1. Introduction
This document contains information on how to extract information from the Techila Server database in order to generate CPU usage based reports. The database structure and example queries shown in this document are applicable for the following Techila Server configurations:
-
Techila Virtual Server version 2013-04-05 (or newer)
-
Techila Server updated with Service Pack 2013-04-02 (or newer)
-
Techila Server deployed in Microsoft Azure
-
Techila Server deployed in Google Compute Engine
-
Techila Server deployed in Amazon EC2
If you are using a different Techila Server configuration, the database structure and queries might differ from the ones shown in this document.
The structure of this document is as follows:
Generating Reports contains instructions for adding new reports to the Techila Web Interface. Instructions are also provided about how to run existing reports and how to choose the desired output format (html, xml or csv).
Example Reports contains example reports and SQL queries that can be used when adding new reports to the Techila Web Interface.
Techila Server Database contains a pruned database schema showing the relevant tables that contain CPU time usage information. A description of the columns in each table is also provided. The tables described in this chapter can be used as reference when creating your own SQL queries to extract reporting information.
Configuring User Features contains instructions on how to configure User Features by using the Techila Web Interface.
2. Generating Reports
`Reports `are typically used to extract CPU time usage information from the Techila Distributed Computing Engine (TDCE) environment. New reports can be added by using the Techila Web Interface when logged as a user with administrative access.
Reporting data is extracted by running SQL queries on the Techila Server by using the Techila Web Interface. Depending on your Techila Server configuration, the Techila Server will have one of the databases listed below:
| Techila Server Type | Database Type |
|---|---|
Techila Server in Microsoft Azure |
Azure SQL |
Techila Virtual Server |
PostgreSQL |
Techila Server in Amazon EC2 |
|
Techila Server in Google Compute Engine |
Some of the example queries shown in this document are database specific. Please use the query compatible with database of your Techila Server.
The following Chapters contain examples on how to add new reports and run existing reports in your TDCE environment.
2.1. Adding New Reports
This Chapter contains instructions on how to add new reports using the Techila Web Interface.
-
Log in to the Techila Web Interface with a user account that has administrative rights.
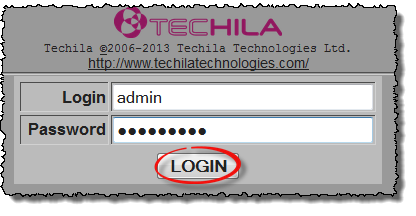 Figure 1. Logging in to the Techila Web Interface.
 -
Navigate to Admin → Reports and click the Add New Report button.
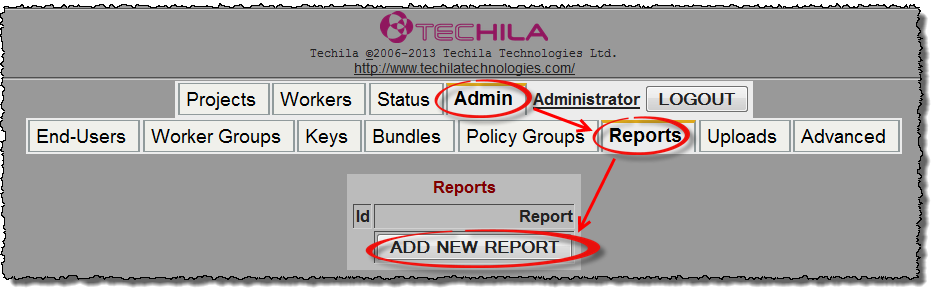 Figure 2. If no reports have been added, the "Reports" page should resemble the one illustrated here.
 -
A new page will be displayed, which can be used to specify the SQL query that will be executed when the report is executed.
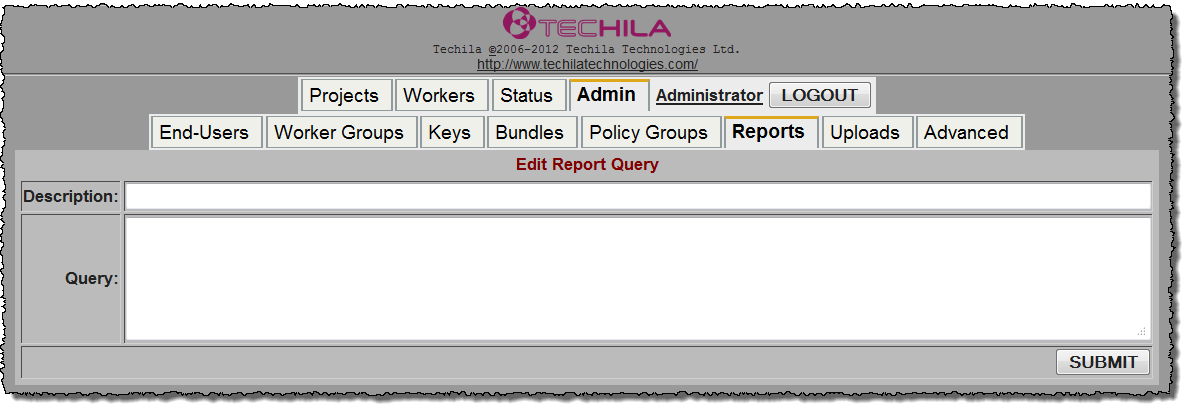 Figure 3. The view before filling any fields on the page.
 -
Enter the desired report description in the "Description" field and the actual SQL query in the "Query" field.
In this example, the query shown below will be used. Please see Example Reports for more examples on SQL queries that can be used to extract CPU usage data.
Field Value Description
CPU Time Usage of All End-Users
Query
select login, username, sum(projectjobs.cputime) as cpu from projects join projectjobs on projects.projectid = projectjobs.projectid join users on projects.createdby = users.userid group by login,username order by cpu;
-
After filling in the fields, the view should resemble the one illustrated below. Click the Submit button to add the new report.
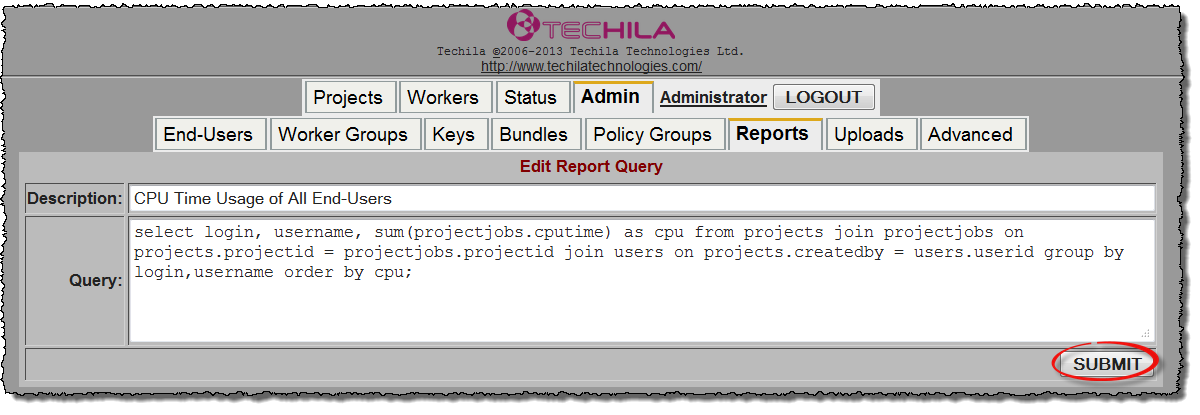 Figure 4. View after filling the fields. Clicking Submit will add the report.
After clicking the "Submit" button the fields will be automatically cleared. The report has now been successfully added and can be used to run the SQL query you specified.
If you wish, at this point you can also add additional reports by repeating steps 3-5. If you don’t want to add additional reports, continue to the next step.
-
Click on Reports to return to the Reports page.
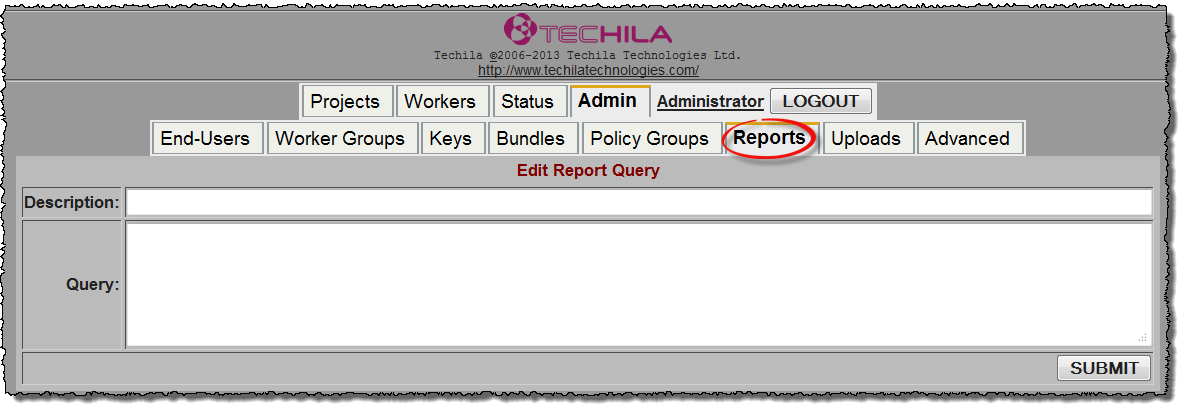 Figure 5. Click Reports to view the report that was added.
 -
After navigating to the "Reports" page, the report you added will be visible in the "Reports" table as illustrated below. Please see Running Existing Reports for instruction on how to run reports.
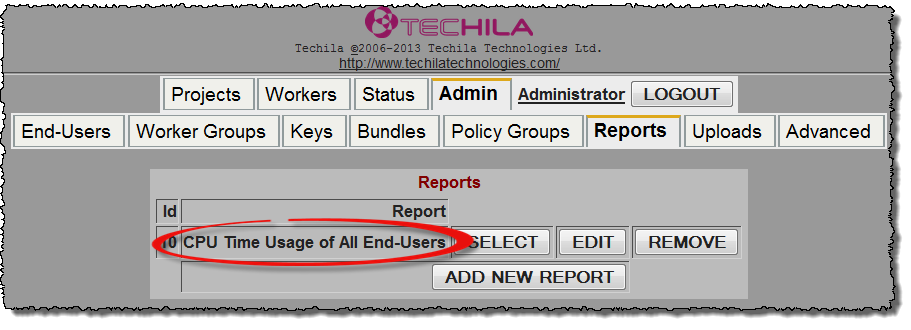 Figure 6. The report will be identified with the "Description" you entered earlier.
2.2. Running Existing Reports
This Chapter contains instructions how to run existing reports using the Techila Web Interface.
-
If required, log in to the Techila Web Interface with a user account that has administrative rights.
-
Navigate to Admin → Reports.
-
Choose the report you wish to run and click the Select button.
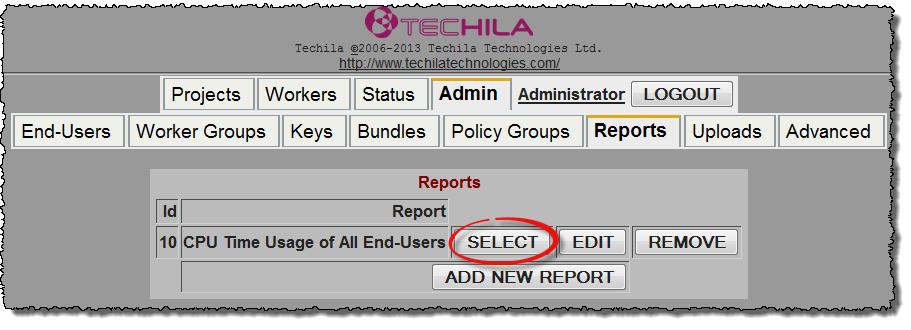 Figure 7. Selecting the report.
 -
After clicking the "Select" button, a new window will be displayed that can be used to choose the desired output format.
Choose the report output format by clicking the CSV, XML or HTML button. Choosing "HTML" will display the reporting data on the page. Choosing "CSV" or "XML" will enable you to download the data in the specified format to your computer.
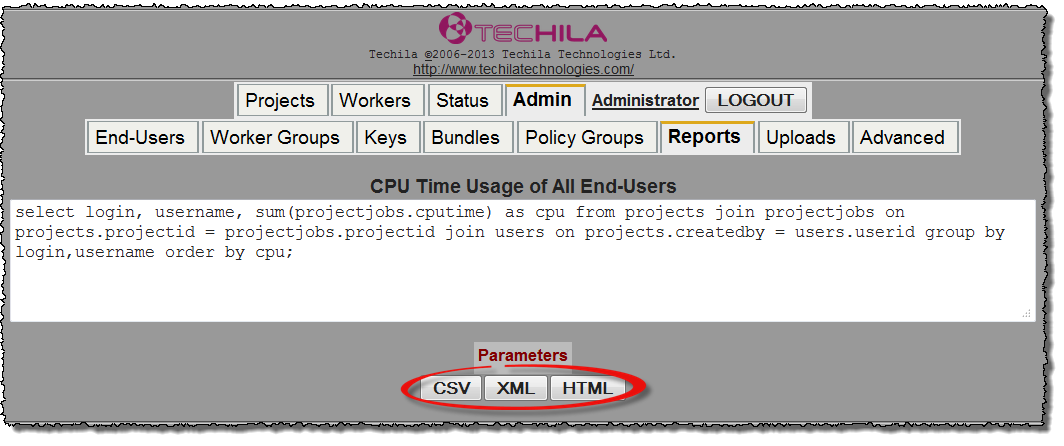 Figure 8. Select the report output format of the.
 -
After choosing the format, the query will be executed and reporting data will be extracted from the Techila Server database. In the example below, HTML was selected as the output format meaning data will be displayed on the website.
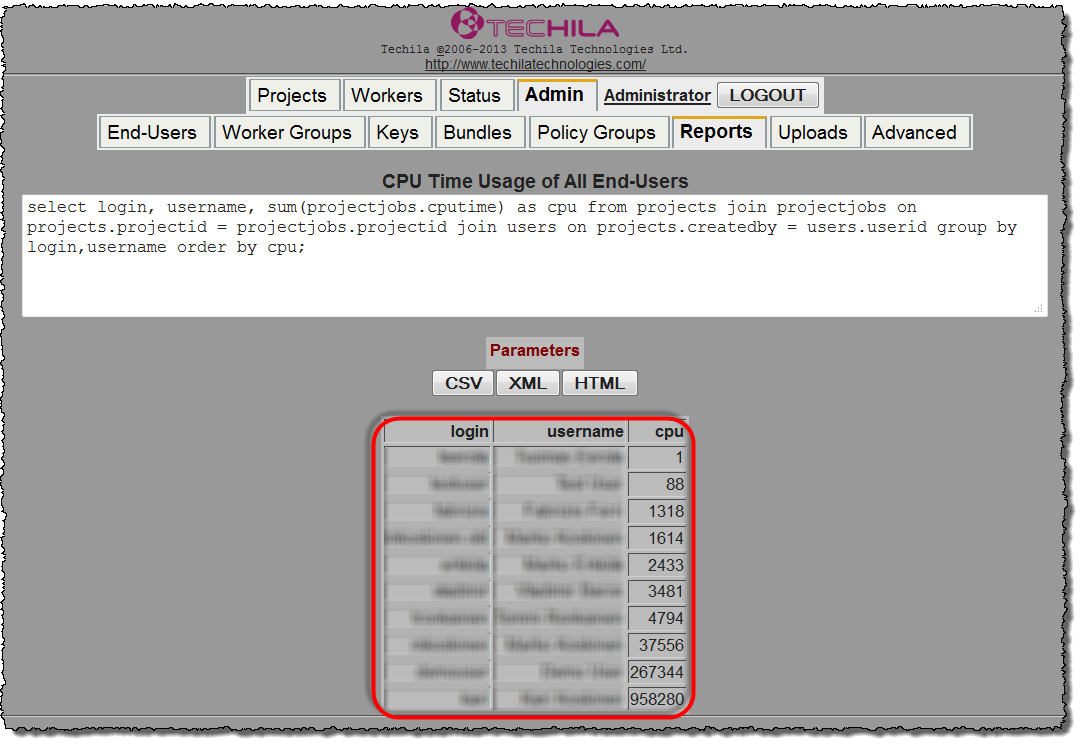 Figure 9. When clicking on the "HTML" button, the data will be displayed on the "Reports" page.
2.3. Generating Reports Programmatically via Techila Administrator CLI
The Techila SDK contains the techila.jar file, which contains the Techila Administrator Command Line Interface (CLI). This Administrator CLI can be used to generate reports on the Techila Server.
Please see Techila Command Line Interface for Administrators for more information on how to use the Administrator CLI for generating reports.
3. Example Reports
This Chapter contains example reports that can be used to extract CPU usage statistics from your Techila Distributed Computing Engine (TDCE) environment.
All example reports shown in this Chapter will display CPU time used in completed computational Jobs and do not include the CPU time used in Jobs that were retried or interrupted. To display CPU time used in all Jobs (including Jobs that were started but not completed), replace the cputime notation used in the queries with totalcputime.
Some of the example queries shown are specific to the Techila Server database type. When mentioned, please use the query compatible with the database type of your Techila Server.
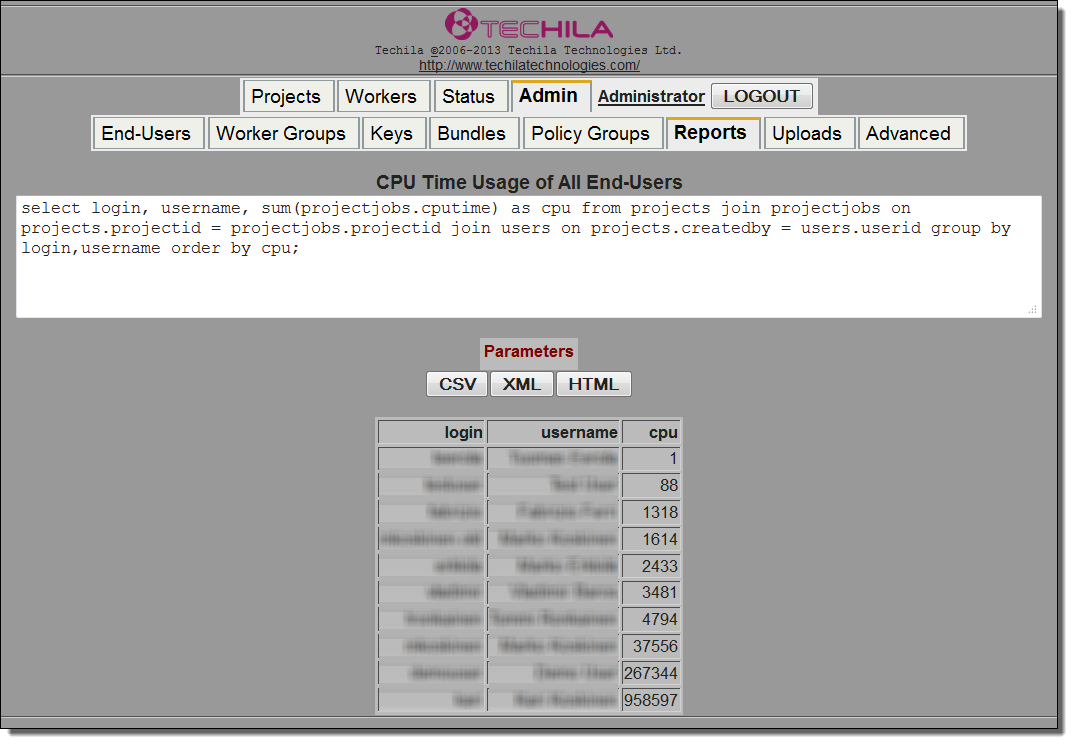
3.1. CPU Time Usage of All End-Users
The example query shown in this Chapter can be used to extract all CPU time used by all End-Users in your TDCE environment. The query will generate one line of output for each End-User in your environment. Each line will display the combined amount of CPU time used in the Projects created by that specific End-User.
To extract the information, create a report containing the query shown below according to the instructions in Adding New Reports. The query shown below is valid for both Windows Azure SQL and PostgreSQL databases.
Note! The latest Techila Server versions automatically include this report. This means that if you are using a relatively recent version of the Techila Server, you will not need to create this report manually.
| Field | Value |
|---|---|
Description |
CPU Time Usage of All End-Users |
Query |
select login, username, sum(projectjobs.cputime) as cpu from projects join projectjobs on projects.projectid = projectjobs.projectid join users on projects.createdby = users.userid group by login,username order by cpu; |
After adding the report, run the report according to the instructions in Running Existing Reports.
An example output of the query is shown below. The login column contains the Techila Web Interface login of the End-User. The username column contains the End-Users name that has been configured in the Techila Web Interface. The cpu column contains the useful CPU time (in seconds) used in Projects created by the End-User.
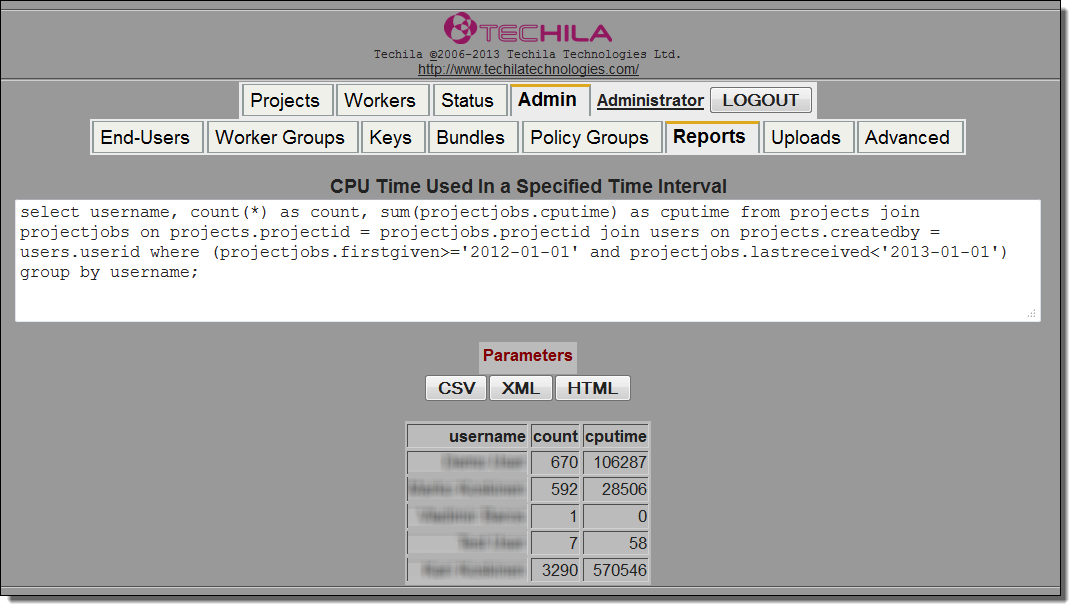
3.2. CPU Time Used In a Specified Time Interval
The example query shown in this Chapter can be used to extract useful CPU time used by all End-Users in a specified time interval. The query will generate one line of output per End-User. Each line will contain the amount of CPU time used by that End-User.
When executing the query, the start and end times are specified using the following notation:
YYYY-MM-DD
Note! The time interval used in the example query shown below is from 2012-01-01 (start of the interval) to 2013-01-01 (end of the interval). Please modify the values of the start and end times to match the time interval of your choosing.
To extract the information, create a report containing the query shown below according to the instructions in Adding New Reports. The query shown below is valid for both Windows Azure SQL and PostgreSQL databases.
Note! The latest Techila Server versions automatically include this report. This means that if you are using a relatively recent version of the Techila Server, you will not need to create this report manually.
| Field | Value |
|---|---|
Description |
CPU Time Used In a Specified Time Interval |
Query |
select username, count(*) as count, sum(projectjobs.cputime) as cputime from projects join projectjobs on projects.projectid = projectjobs.projectid join users on projects.createdby = users.userid where (projectjobs.firstgiven>='2012-01-01' and projectjobs.lastreceived<'2016-01-01') group by username; |
After adding the report, run the report according to the instructions in Running Existing Reports.
An example output of the query is shown below. The username column contains the End-Users name that has been configured in the Techila Web Interface. The count column contains the number of Projects created during the specified time interval. The cputime column displays the amount of useful CPU time used in the Projects in the time interval.
3.3. End-User Specific CPU Time Usages
End-User Specific CPU time usage reports can be generated by using User Features. User Features are key-value pairs which are defined by the Techila administrator by using the Techila Web Interface. When configured, these features can be used to generate reports where CPU time usage is grouped on a key-value basis. These key-value pairs can e.g. used to group users in your Techila environment in different groups to generate department specific usage reports.
This example query shows how to extract CPU time used by all End-Users with a specified User Feature. Please note that in order to generate User Feature specific reports you will need to configure User Features for End-Users in your TDCE environment. Instruction for configuring User Features can be found in Configuring User Features.
Note! The example query shown below will group the CPU time usage based on the values of the department User Feature. Please modify the department notation in the query to match the one you are using in your TDCE environment. Instructions on how to configure User Features can be found in Configuring User Features.
To extract the information, create a report containing the query shown below according to the instructions in Adding New Reports. The query shown below is valid for both Windows Azure SQL and PostgreSQL databases.
Note! The latest Techila Server versions automatically include this report. This means that if you are using a relatively recent version of the Techila Server, you will not need to create this report manually.
| Field | Value |
|---|---|
Description |
End-User Specific CPU Time Usages |
Query |
select value as department,sum(projectjobs.cputime) as cputime from users left outer join userfeatures on users.userid=userfeatures.userid join projects on projects.createdby=users.userid join projectjobs on projects.projectid=projectjobs.projectid where feature='department' or feature is null group by value; |
After adding the report, run the report according to the instructions in Running Existing Reports.
An example output of the query is shown below. The department column contains a list of values for the specified User Feature department. The first line on the department column corresponds to all End-Users that do not have the specified User feature configured. The cputime column contains the combined amount of used CPU time (in seconds) for End-Users with the specified value of the User Feature.
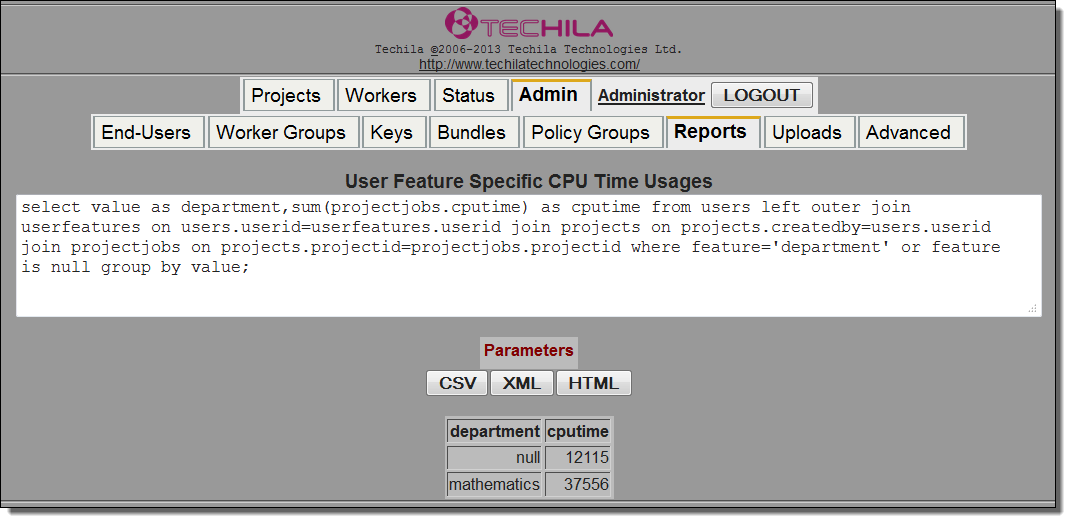
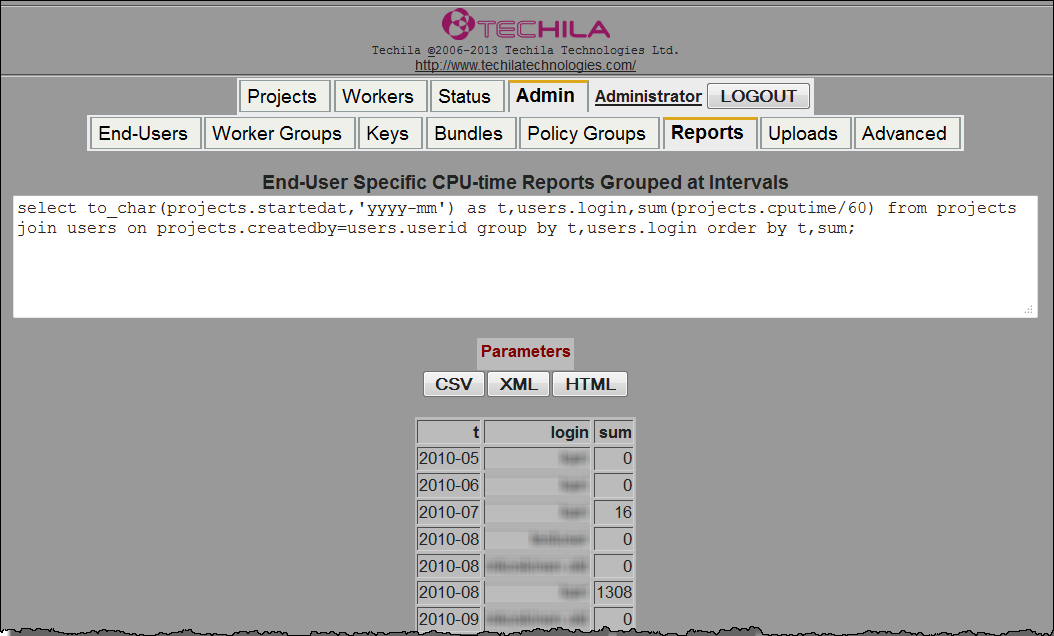
department defined have used 12115 seconds of CPU time. Users that have mathematics as the value for the department feature have used 37556 seconds of CPU time.3.4. End-User Specific CPU-time Reports Grouped at Intervals
The example query shown in this Chapter can be used to extract CPU time used by all End-Users and display the CPU-usages on a per month basis.
To extract the information, create a report containing the query shown below according to the instructions in Adding New Reports.
Note! The latest Techila Server versions automatically include this report. This means that if you are using a relatively recent version of the Techila Server, you will not need to create this report manually.
Note! The queries for this report are database specific. Please use the query compatible with your database type.
| Field | Value |
|---|---|
Description |
End-User Specific CPU-Time Reports Grouped at Intervals |
Query |
Windows Azure SQL: PostgreSQL: |
After adding the report, run the report according to the instructions in Running Existing Reports.
An example output of the query is shown below. The t column contains the year and month (format YYYY-MM) for which the CPU time usage is shown. The login column contains the End-Users login to the Techila Web Interface. The sum column contains the amount of CPU time (in minutes) used in Projects created by the End-User in the specified month.
4. Techila Server Database
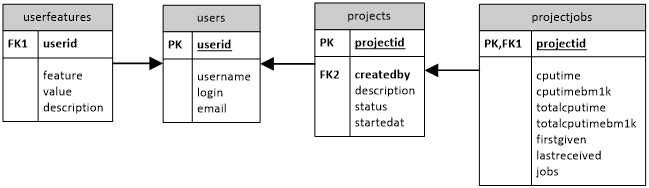
This Chapter contains a pruned database schema of the Techila Server that displays the tables containing CPU time usage information.
4.1. Database Schema
4.2. Tables
This Chapter contains descriptions on the tables shown in the pruned database schema.
4.2.1. projects
The projects table contains information on Projects. Table fields are described below.
| Table: projects | ||
|---|---|---|
Field |
Type |
Description |
projectid |
integer |
The Project ID number |
description |
text |
The description of the Project |
status |
integer |
The status of the Project (e.g. running, stopped,..) |
createdby |
integer |
The user id of the End-User that created the Project |
startedat |
datetime (Windows Azure SQL ) |
Time when the Project was started. |
4.2.2. projectjobs
The projectjobs table contains information on Jobs belonging to a specific Project. Table fields are described below.
| Table: projectjobs | ||
|---|---|---|
Field |
Type |
Description |
projectid |
integer |
The Project ID number |
cputime |
bigint |
The used CPU time in completed Jobs (in seconds). Corresponds to the |
cputimebm1k |
bigint |
Scaled used CPU time (in seconds). Normalized by using a BM of 1000. |
totalcputime |
bigint |
The total CPU time used, including retries etc. (in milliseconds). Corresponds to the |
totalcputimebm1k |
bigint |
Scaled total CPU time used, including retries etc. (in milliseconds). Normalized by using a BM of 1000. |
firstgiven |
- timestamp without time zone (PostgreSQL) |
The time when the first Job is deployed |
lastreceived |
- timestamp without time zone (PostgreSQL) |
The time when the last result is received by the Techila Server. |
jobs |
integer |
The number of Jobs in the Project |
4.2.3. users
The users table contains information on the End-Users in the Techila environment. Table fields are described below.
| Table: users | ||
|---|---|---|
Field |
Type |
Description |
userid |
integer |
The id of the user |
username |
text |
The name of the user |
login |
text |
The account name of the user |
text |
Email address of the user |
|
4.2.4. userfeatures
The userfeatures table contains information on User Features that have been configured. Table fields are described below.
| Table: userfeatures | ||
|---|---|---|
Field |
Type |
Description |
userid |
integer |
The id of the user. Links to |
feature |
text |
The feature key |
value |
text |
The feature value |
description |
tex |
The feature description |
5. Configuring User Features
User Features can be created by using the Techila Web Interface. User Features are required in order to create CPU time usage reports where the usage is grouped based on the value of the User Feature.
The following example procedure shows how to configure a User Feature for an existing user.
-
Log in as an administrator to the Techila Web Interface
-
Click on End-Users.
-
Click on the Login of the End-User to open the User settings page.
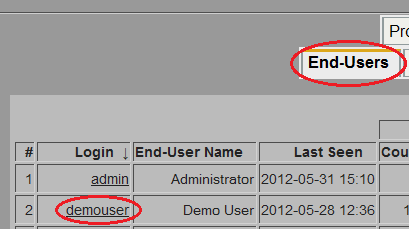 Figure 15. Clicking the link in the
Logincolumn will open the User Settings page. -
On the User Settings page, scroll down and locate the User Features table
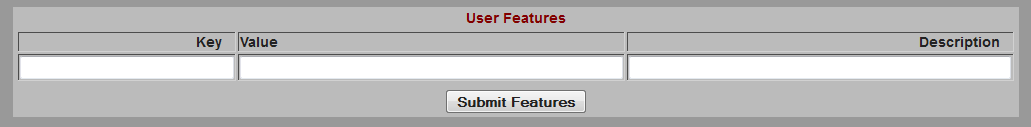 Figure 16. By default, the User Features table will be empty.
 -
Create a User Feature by specifying desired values to the Key, Value and Description fields.
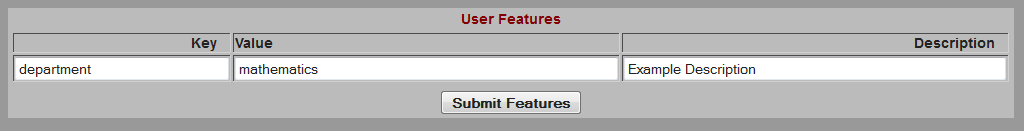 Figure 17. In this example, the
departmenthas been entered in the Key field andmathematicsin the Value field. -
Click the Submit Features button. The feature will be created and the Key field will become locked.
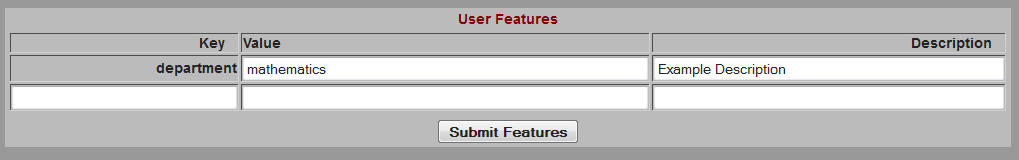
Additional features can be added by specifying additional Key-Value pairs. To remove a User Feature, clear the Value field of the feature you wish to remove and click on the Submit Features button